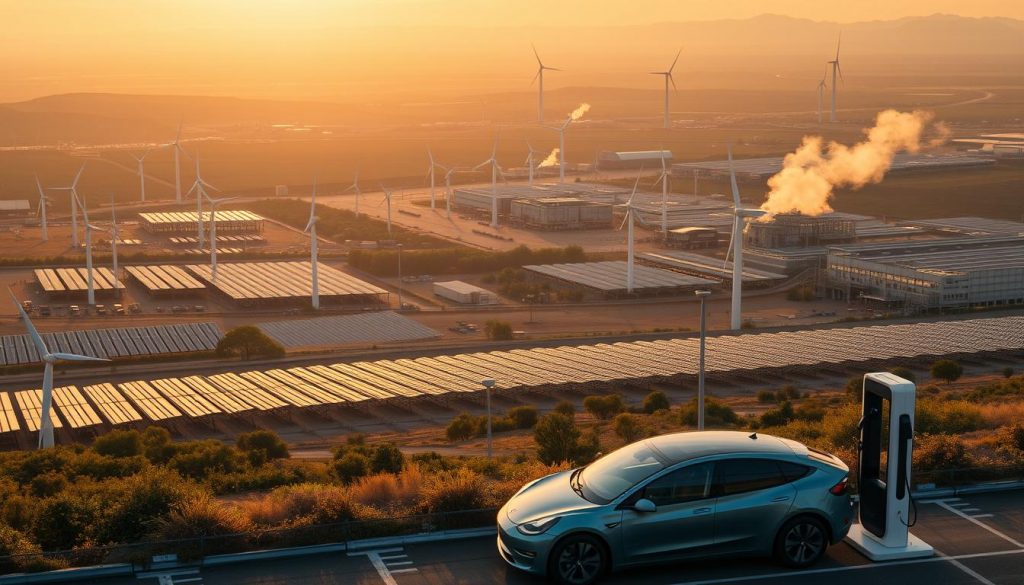
Has the world’s energy system finally reached a historic tipping point? The first six months of 2025 have delivered a powerful answer, marking a period of unprecedented change in how electricity is generated.
This analysis, drawing on data from 88 nations representing 93% of worldwide demand, reveals a clear and decisive shift. For the first time on record, renewable sources have overtaken coal in the global electricity mix.
The growth of solar and wind energy has been so significant that it has not only matched but surpassed the increase in global electricity demand. This milestone signals a profound acceleration in the clean energy transition.
Understanding these developments is crucial for grasping the current state and future direction of our energy landscape. The insights from this period offer a vital snapshot of progress and the challenges that lie ahead.
Key Takeaways
- Renewables surpassed coal’s share of global electricity generation for the first time in the first half of 2025.
- Solar and wind growth exceeded the increase in worldwide electricity demand.
- The analysis encompasses 88 countries, accounting for 93% of global power demand.
- This period marks a significant acceleration in the clean energy transition.
- The data provides essential insights for policymakers and industry leaders.
- Different regions are navigating the shift from fossil fuels at varying paces.
Industry Overview and Global Clean Energy Trends
A closer examination of the first half of 2025 shows how energy systems worldwide are adapting to changing economic and environmental conditions. The industry demonstrated remarkable resilience during this period, navigating complex challenges while maintaining steady progress.
Global Electricity Demand and Growth Drivers
Electricity demand increased by 2.6% during the first six months, adding 369 TWh to global consumption. This growth rate aligns closely with the ten-year historical average, indicating a return to more typical patterns.
China remained the dominant driver, accounting for 54% of the worldwide increase. The United States contributed 21%, while India’s contribution was notably subdued due to milder weather conditions.
The Shift Towards Clean Energy
The transition to clean energy sources accelerated dramatically throughout this period. Renewable technologies are now actively displacing traditional fossil fuel generation across many nations.
Countries are experiencing this transformation at different speeds, influenced by local resources and policy frameworks. The convergence of declining costs and improving storage technologies has created significant momentum for the deployment of clean energy.
Discover how clean energy can provide silent, emission-free, and cost-effective backup power in our essential guide.
Surge in Electricity Demand & Renewable Energy Growth
A dramatic acceleration in clean energy deployment has transformed how nations meet their electricity needs. The first six months saw renewables not only keeping pace with rising consumption but also actively displacing conventional sources.
Electricity Demand 2025: Key Drivers and Metrics
Global electricity consumption increased by 369 TWh during this period. This growth was primarily driven by industrial expansion and the ongoing electrification of transport systems.
Data centres and digital infrastructure also contributed significantly to the demand increase. Weather patterns played a role, with milder conditions in some regions moderating what could have been even higher consumption.
| Energy Source | Change (TWh) | Percentage Change | Contribution to Demand Growth |
|---|---|---|---|
| Solar | +306 | +31% | 83% |
| Wind | +97 | +7.7% | 26% |
| Nuclear | +33 | +2.5% | 9% |
| Hydro | -42 | -2% | -11% |
Solar and Wind: Outpacing Traditional Sources
Solar generation achieved remarkable expansion, growing by 306 TWh. This represents the fastest absolute growth rate ever recorded for the technology.
Wind energy complemented this performance with 97 TWh of additional generation. Together, these clean sources added 403 TWh—surpassing the entire global demand increase of 369 TWh.
The combination demonstrates that renewable sources have achieved sufficient scale to not only serve new demand but also begin displacing existing fossil generation.
Global Power Sector Update: Mid-Year Insights 2025 – Detailed Analysis
Monthly generation statistics from nearly 90 countries provide unprecedented clarity on the transition occurring across different regions. This detailed examination reveals how electricity systems evolved during the initial six months of the year.

Data Insights from 88 Countries
The analysis synthesises information from 88 nations representing 93% of worldwide electricity consumption. Comparing January to June 2025 with the same period in 2024 enables a precise measurement of changes.
Particular attention focuses on the four largest CO₂-emitting economies. These countries collectively account for 63% of global electricity generation and 64% of power sector emissions.
Data reveals significant variations in how different countries experience the energy transition. Factors include the availability of renewable resources and existing infrastructure.
Emerging economies typically show faster demand growth. Developed nations focus more on replacing existing fossil fuel generation with cleaner sources.
The comprehensive coverage ensures identified trends represent genuine patterns rather than regional anomalies. This provides valuable foresight for policy development and investment decisions.
Renewables Overtake Coal: A Milestone in Clean Power Trends
The balance of electricity generation shifted decisively in favour of clean technologies. For the first time in recorded history, renewable sources produced more electricity than coal during the initial six months of this year.

This historic crossing point marks a pivotal shift in the way the world generates power. Renewables achieved 5,072 TWh of generation compared to coal’s 4,896 TWh.
Record Growth in Solar Generation
Solar energy experienced extraordinary growth, increasing by 306 TWh. This represents a 31% increase that boosted solar’s share to 8.8% of the global electricity mix.
China led this growth, accounting for 55% of the worldwide increase. The United States contributed 14%, while the European Union added 12%.
Wind Energy’s Role in the Global Mix
Wind generation increased by 97 TWh, maintaining its position as the second-largest renewable source. Wind’s share rose to 9.2% of total electricity production.
The technology continues to play a crucial role in the clean energy transition. It complements solar’s rapid expansion effectively.
Fossil Fuels in Decline
Coal generation fell by 31 TWh as renewables met increasing demand. Fossil fuel generation overall declined by 27 TWh during this period.
The displacement of conventional sources marks significant progress. However, the pace of decline remains slower than climate targets require.
| Energy Source | Generation (TWh) | Change from H1 2024 | Market Share |
|---|---|---|---|
| Renewables | 5,072 | +363 TWh | 34.3% |
| Coal | 4,896 | -31 TWh | 33.1% |
| Solar | 1,302 | +306 TWh | 8.8% |
| Wind | 1,365 | +97 TWh | 9.2% |
Regional Patterns, Emissions & Capacity Trends
While global trends indicate that renewables are surpassing coal, regional patterns reveal a more complex story of progress and setbacks. The first half of 2025 saw significant variations in how major economies managed their energy transitions.
Variations Across Major Economies
Carbon emissions trajectories diverged significantly. China and India reduced their power sector emissions despite growing electricity demand. Clean generation growth outpaced demand increases in both countries.
In contrast, the European Union and the United States experienced a rise in emissions. Strong solar growth in the EU could not offset shortfalls in wind and hydro output. The US experienced increased fossil fuel generation as clean energy sources failed to meet demand growth.
Emissions Plateau and Carbon Intensity Insights
Global power sector CO2 emissions fell marginally by 0.2% to 6,963 MtCO2. This plateau occurred despite a 2.6% increase in global electricity demand.
Without solar and wind expansion, emissions would have risen by approximately 236 MtCO2. This highlights the critical role renewable deployment already delivers in climate mitigation.
| Region/Country | CO2 Emissions Change | Electricity Demand Change | Primary Factor |
|---|---|---|---|
| China | -46 MtCO2 (-1.7%) | +198 TWh (+4.2%) | Renewables exceeded demand growth |
| India | -24 MtCO2 (-3.6%) | +12 TWh (+1.3%) | Milder weather reduced demand |
| European Union | +13 MtCO2 (+4.8%) | Steady | Wind/hydro shortfalls |
| United States | +33 MtCO2 (+4.3%) | Increased | Clean sources lagged demand |
Emerging Challenges, Investment Dynamics, and Future Risks
As clean energy technologies achieved unprecedented scale, new investment patterns and infrastructure requirements emerged as central considerations for maintaining momentum. The record solar capacity additions highlighted both progress and persistent obstacles.
Infrastructure Investment and Capacity Additions
Solar installations reached 380 GW during the first half, a 64% increase over the same period last year. China accounted for 67% of these additions, demonstrating its pivotal role in renewable deployment.
The May surge, driven by new pricing rules, showed how policy transitions create powerful investment incentives. However, this also raises questions about sustainable deployment patterns.
| Technology | Capacity Added (GW) | Year-over-Year Change | Leading Contributor |
|---|---|---|---|
| Solar | 380 | +64% | China (67%) |
| Wind | 98 | +12% | United States (24%) |
| Storage | 45 | +28% | European Union (31%) |
Energy security concerns are driving investment as countries seek to reduce dependence on imported fossil fuels. Storage technologies are becoming critical for managing renewable intermittency.
Infrastructure needs extend beyond generation to transmission upgrades and smart grid systems. Policy frameworks vary significantly across different economies, creating uneven investment landscapes.
Future risks include supply chain constraints and challenges related to grid integration. The pace of fossil fuel phase-down remains insufficient, despite the growth of renewable energy.
Conclusion: Global Power Sector Update: Mid-Year Insights 2025
Clean energy technologies achieved unprecedented momentum in the first six months. The historic milestone where renewables overtook coal’s share of electricity generation marks a fundamental shift in our energy systems.
Solar and wind growth not only met but exceeded global demand increases. This demonstrates their capacity to drive the transition forward. The comprehensive data analysis confirms this turning point.
Looking ahead, key priorities include accelerating grid modernization and storage deployment. Countries must strengthen policy frameworks to maintain investment momentum. Streamlining permitting processes remains crucial for sustained growth.
The challenge now involves scaling these technologies more rapidly while managing the phase-down of fossil fuels. This requires coordinated action across all regions to ensure a fair and equitable transition.


